Volume
Learn how volume confirms momentum, validates breakouts and exposes weak moves.

Volume
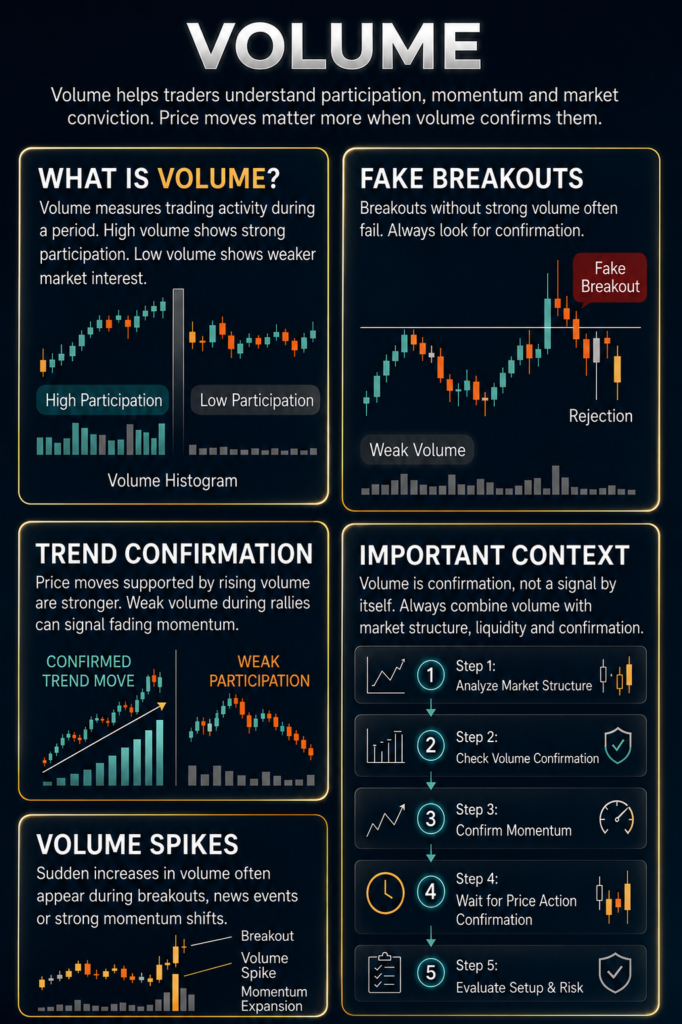
- Volume confirms price
- High volume supports breakouts
- Weak volume increases fakeout risk
- Always combine volume with structure
- Watch for spikes near liquidity
Volume shows how much participation exists behind price movement. It helps traders understand whether a move has strength or lacks conviction.
What Volume Means
Volume measures how much buying and selling activity happens during a candle or period.
Strong volume often confirms momentum, breakouts and continuation.
Weak volume can suggest hesitation, lack of conviction or fakeouts.
Price may move quickly, but without participation the move becomes less reliable.
How To Read Volume
Volume becomes most useful when combined with market structure and price action.
- High volume on breakout = stronger confirmation
- Low volume on breakout = higher fakeout risk
- Volume spike near key level = possible reaction
- Rising volume during trend = stronger conviction
Strong traders do not only watch price. They also watch who is participating in the move.
Volume And Market Strength
Volume helps reveal whether momentum has support behind it.
- Rising price + rising volume = stronger move
- Rising price + weak volume = possible exhaustion
- Falling price + rising volume = stronger selling pressure
- Falling price + weak volume = weaker bearish conviction
Volume alone does not predict direction. It confirms participation behind price.
How To Use This
- Watch volume during breakouts
- Compare strong and weak candles
- Look for volume spikes at liquidity zones
- Use volume together with structure
Volume adds confidence to price action, but structure still comes first.
Quick Recap
- Volume measures participation
- High volume confirms stronger conviction
- Low volume increases fakeout risk
- Always combine volume with structure
- Price moves first. Volume confirms if the move matters.
Relative Volume Formula:
Current Volume ÷ Average Volume
= Relative Volume (RVOL)
How to read it:
RVOL above 1.0
- Above normal market activity
- Participation expanding
- Momentum has stronger support
RVOL around 1.0
- Normal activity
- Balanced participation
- No strong volume edge
RVOL below 1.0
- Reduced activity
- Lower conviction
- Price moves may become less reliable
Example:
Current BTC candle volume = 15,000 BTC
Average volume = 10,000 BTC
15,000 ÷ 10,000 = 1.5 RVOL
Meaning:
Current activity is 50% higher than normal.
This suggests stronger market participation.
Beginner Pro-Tips:
- Fuel Check: volume acts as fuel for price movement. Low RVOL often means weaker participation and less momentum support
- Chart Setup: many traders compare volume bars against the 20-period Volume Moving Average to spot unusual activity
- The Trap: when price expands aggressively but RVOL stays weak, the move may lack real participation
Key idea:
Price can move without volume, but stronger moves usually need stronger participation.