Cumulative Volume Delta (CVD)
Learn how buying and selling pressure influence price movement and reveal hidden market strength.

Cumulative Volume Delta (CVD)
- Never use CVD alone
- Watch for divergence at key levels
- Use CVD with liquidity and structure
- Confirm before entering
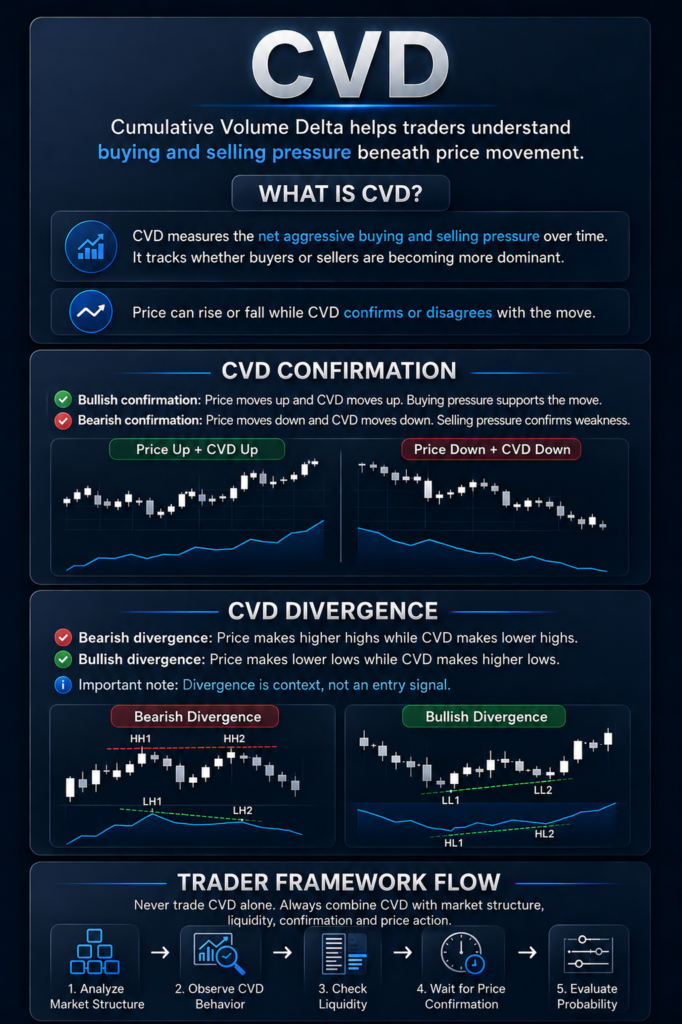
Cumulative Volume Delta, or CVD, helps traders understand who is being more aggressive in the market. It compares buying pressure and selling pressure behind price movement.
What CVD Shows
CVD helps reveal hidden strength or weakness that candles alone may not show.
When aggressive buyers dominate, CVD tends to rise.
When aggressive sellers dominate, CVD tends to fall.
This helps traders understand if price movement has real participation behind it.
How To Read CVD
CVD becomes most useful when compared with price action.
- Price rising with rising CVD = stronger move
- Price falling with falling CVD = stronger bearish pressure
- Price rising while CVD weakens = possible exhaustion
- Price falling while CVD rises = possible reversal setup
CVD does not predict direction. It confirms pressure behind a move.
CVD Divergence
Divergence appears when price and CVD stop moving together.
- Higher highs in price with lower highs in CVD = buyer weakness
- Lower lows in price with higher lows in CVD = seller weakness
Divergence often acts as an early warning sign, not an instant entry signal.
How To Use This
- Start with market structure
- Mark liquidity or reaction zones
- Watch how CVD behaves near key areas
- Wait for confirmation before entering
The best setups happen when CVD aligns with structure and liquidity.
Quick Recap
- CVD measures buying vs selling pressure
- Price and CVD together create stronger confirmation
- Divergence can warn about traps
- Always confirm with structure
- Price shows movement. CVD shows conviction behind the move.
CVD Logic:
CVD ↑ + Price ↑ = trend confirmation
Bullish CVD = buyers stronger
CVD ↓ + Price ↓ = bearish confirmation
Bearish CVD = sellers stronger
CVD ↓ + Price ↑ = divergence warning
Bearish Divergence = buying pressure weakening
CVD ↑ + Price ↓ = divergence warning
Bullish Divergence = selling pressure weakening
Advanced context:
- CVD ↓ + Price ↑ = possible Short Absorption
- Passive buyers absorb aggressive market sellers
- CVD ↑ + Price ↓ = possible Long Absorption
- Passive sellers absorb aggressive market buyers
How to read it:
- Rising CVD = aggressive buyers stronger
- Falling CVD = aggressive sellers stronger
- Price and CVD moving together = stronger confirmation
- Price moving opposite to CVD = warning signal
The Steering Wheel vs The Wall:
Think of CVD as aggressive traders pushing the market.
Passive liquidity acts like a wall that can stop price movement.
If CVD pushes hard but price stalls, larger passive orders may be absorbing pressure.
The Retail Trap:
A sharp CVD spike alone is not confirmation.
If CVD rises aggressively but price struggles to move higher, absorption may be happening.
Many traders wait for price reaction before entering.
The Reversal Trigger:
CVD divergences become more useful near support, resistance, supply or demand zones.
If selling pressure weakens near support, reversal probability may improve.
Golden Rule:
CVD confirms aggressive pressure, but structure confirms the trade. Never trade divergence alone.