Reversal vs Retracement
Learn how to separate healthy pullbacks from real trend reversals.

Reversal vs Retracement
- Do not panic during pullbacks
- Wait for BOS confirmation
- Use Fibonacci for retracements
- Watch liquidity before reversals
- Trade structure, not emotion
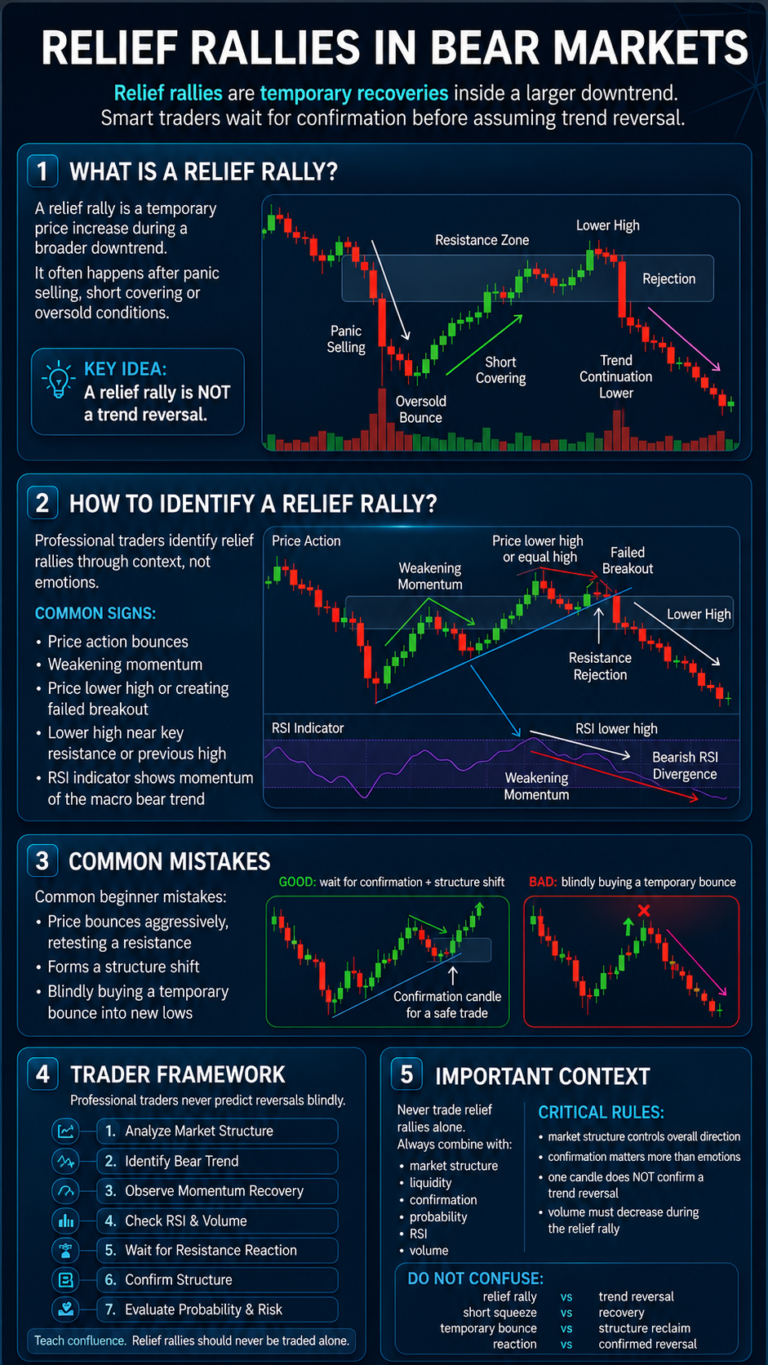
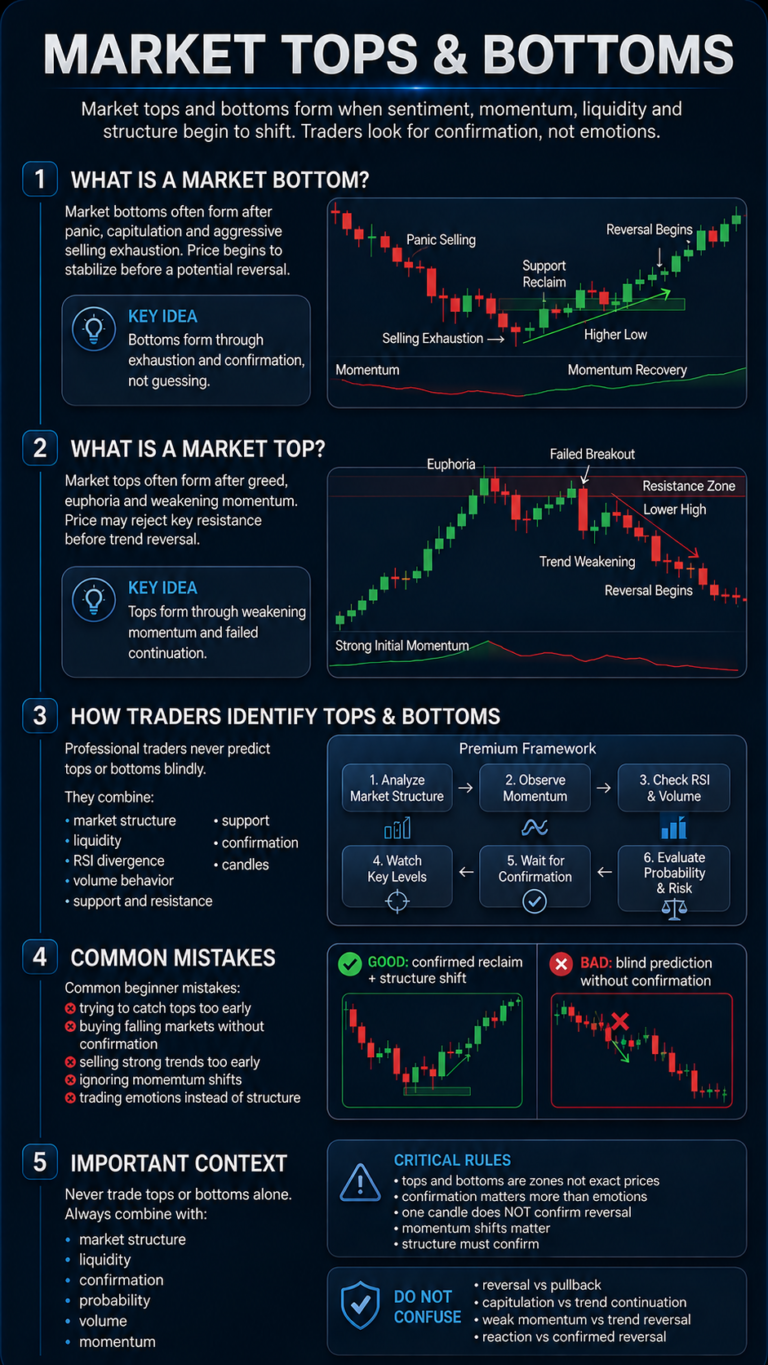
Every trend contains pullbacks and potential reversals. Learning the difference helps traders avoid emotional exits, poor entries and unnecessary losses.
What Is A Retracement?
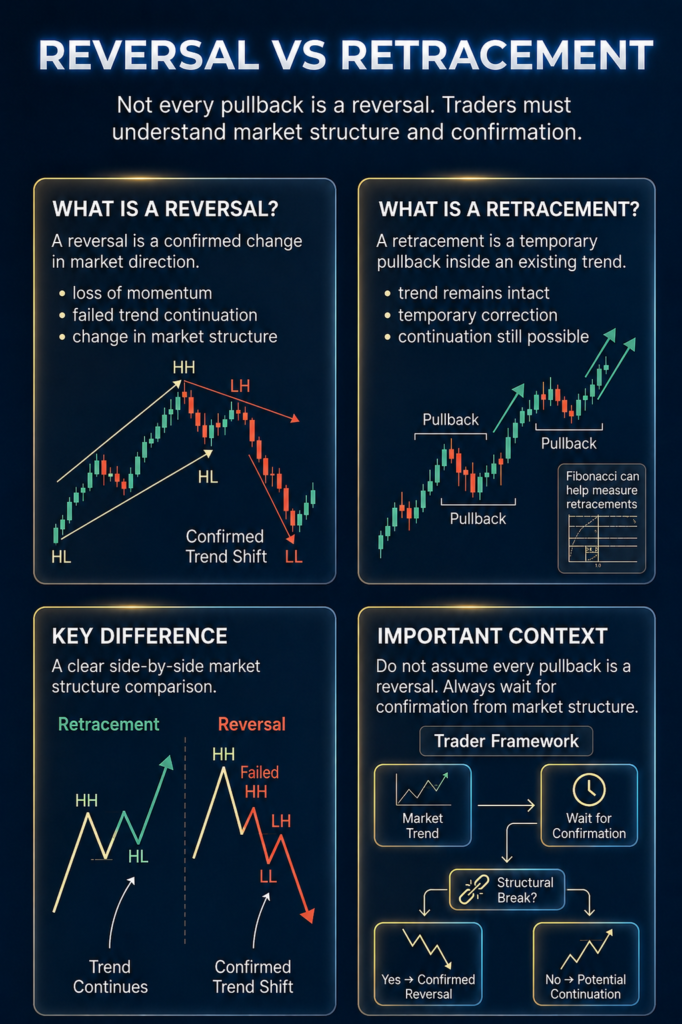
A retracement is a temporary move against the trend before continuation.
In an uptrend, price pulls back but the overall bullish structure remains intact.
In a downtrend, price temporarily rallies before bearish continuation.
Retracements often happen with weaker momentum and lower conviction compared to the main trend.
- Structure stays intact
- Higher low or lower high forms
- Momentum often slows during the pullback
- Price may react near support, resistance or moving averages
Strong traders often wait for retracements instead of chasing extended price moves.
What Is A Reversal?
A reversal is a complete shift in trend direction.
The previous trend weakens and structure starts changing.
- Break of Structure (BOS) appears
- Important support or resistance breaks
- Momentum shifts direction
- Liquidity sweeps often appear before confirmation
- Volume usually expands during the move
A reversal changes market direction. A retracement usually continues the trend.
How To Spot The Difference
Ask simple questions before reacting emotionally.
- Did structure break?
If not, it is often still a retracement. - Did liquidity get swept?
Sweeps often appear before larger reversals. - Did momentum shift?
Strong momentum increases reversal probability. - Did price reclaim or lose an important level?
Retests often help confirm the shift.
Most beginners panic during retracements and exit too early.
Patient traders wait for confirmation before changing market bias.
How To Think About Pullbacks
- Retracement = possible continuation
- Reversal = possible trend change
- Confirmation matters more than emotions
- Structure matters more than prediction
Strong traders react to confirmation, not fear.
Quick Recap
- Retracement means continuation is possible
- Reversal means trend direction changed
- BOS helps confirm reversals
- Momentum and structure matter most
- Wait for confirmation, not emotions
A retracement is opportunity. A reversal changes the story.
- A pullback is not a reversal until structure confirms it.
Fibonacci Formula:
Move × Fibonacci Level
Common retracement zones:
- 23.6% = shallow pullback
- 38.2% = healthy retracement
- 50% = balanced correction
- 61.8% = strong pullback zone
- 78.6% = deep retracement
Example:
BTC moves from $80,000 → $100,000
Total move = $20,000
To find the 61.8% retracement zone:
$20,000 × 0.618 = $12,360
Then subtract from the top:
$100,000 − $12,360 = $87,640
Result:
$87,640 = possible reaction zone where buyers may step in.
How to use it:
In an uptrend:
Swing Low → Swing High
In a downtrend:
Swing High → Swing Low
Most charting platforms like TradingView automatically calculate retracement levels.
Advanced context:
The area between 0.618 and 0.65 is often called the Golden Pocket.
Many traders watch this area for stronger reactions during healthy pullbacks.
Beginner Pro-Tips:
- The High Timeframe Rule: use obvious swing highs and lows from higher timeframes like 1H, 4H or Daily. Small timeframe swings often create weak signals
- The Healthy Pullback Rule: shallow pullbacks often suggest stronger momentum. Deeper pullbacks can still remain healthy if structure stays intact
- The Confirmation Rule: never enter blindly at a Fibonacci level. Wait for rejection, structure shift or reaction before assuming continuation
- The Invalidation Rule: if price aggressively breaks beyond the original swing point, the retracement idea may be invalid and reversal probability increases
Golden Rule:
Fibonacci helps measure pullbacks, not predict reversals. Market structure decides whether the trend still holds.