Fibonacci & VPVR
Learn how Fibonacci retracements and VPVR help identify pullback zones, reaction areas and higher-probability entries.

Fibonacci & VPVR
- Trade with trend direction
- Wait for pullback, not breakout
- Look for confluence with structure
- Never use Fib or VPVR alone
Fibonacci and VPVR help traders improve timing and find stronger reaction zones inside trending markets.
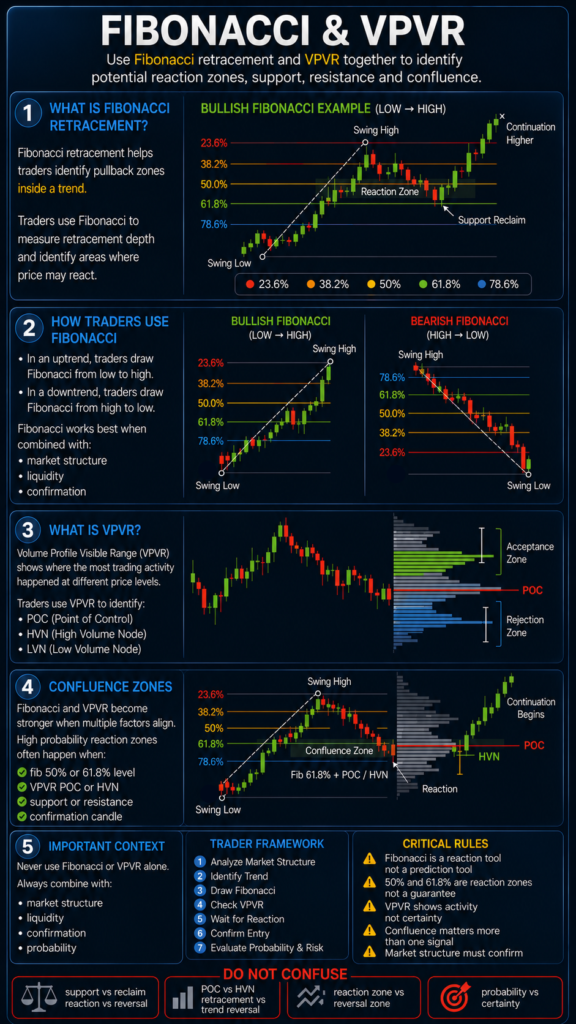
Fibonacci focuses on pullback depth. VPVR focuses on where most trading activity happened.
When combined with structure, they help traders avoid random entries and improve precision.
How Fibonacci Helps
Fibonacci retracement helps traders identify areas where price may react during a pullback.
Instead of chasing price, traders wait for retracement into important levels before looking for confirmation.
- Shallow retracement = strong momentum
- Deeper retracement = better discount price
- Strong reactions often happen inside key zones
- Structure confirmation matters more than the level itself
How VPVR Helps
VPVR shows where most market activity happened at specific price levels.
Heavy volume areas often create stronger reactions and cleaner support or resistance.
- High volume zones often slow price
- Low volume zones often move fast
- Price reacts more often near important volume clusters
- Context matters more than volume alone
How To Use Them Together
High-probability setups often happen when pullback zones align with strong volume areas.
- Wait for trend direction
- Look for a pullback into a Fib area
- Check if VPVR supports the zone
- Confirm with structure, liquidity or candle reaction
The more factors align, the cleaner the setup becomes.
Mistakes To Avoid
- Entering only because a Fib level was touched
- Ignoring market structure
- Trading VPVR without confirmation
- Using too many levels at once
Quick Recap
- Fib helps measure pullbacks
- VPVR helps identify reaction zones
- Confluence improves probability
- Structure confirms the trade
- Confluence beats prediction. Structure confirms the setup.
Fibonacci Framework:
Retracement helps traders estimate where pullbacks may slow down or react.
Key Levels:
- 0.382 = shallow retrace
- 0.500 = balanced retrace
- 0.618 = strong reaction zone
- 0.618–0.650 = Golden Pocket
VPVR Logic:
HVN = High Volume Node = stronger acceptance
LVN = Low Volume Node = faster movement and weaker acceptance
POC = Point of Control = highest traded volume
Trend Context:
In an uptrend:
Swing Low → Swing High
In a downtrend:
Swing High → Swing Low
Most charting platforms automatically calculate Fibonacci levels.
Beginner Pro-Tips:
- The High Timeframe Rule: use major swing highs and lows from 1H, 4H or Daily. Small timeframe swings often create weak or noisy levels
- The Blind Entry Trap: never buy or sell only because price touched a Fibonacci level. Wait for structure, rejection or confirmation
- The X-Marks-The-Spot Rule: stronger setups often appear when the Golden Pocket aligns with an HVN or POC
- The LVN Warning: price often moves quickly through Low Volume Nodes. Many traders place invalidation beyond the LVN instead of inside it
- The Context Check: Fibonacci works best when aligned with market structure and trend direction
Golden Rule:
Fibonacci shows where price may react. VPVR helps judge whether strong participation exists around that level.