Moving Averages (MA & EMA)
Learn how MA and EMA help identify trend direction, momentum and dynamic support or resistance.

Moving Averages (MA & EMA)
- EMA reacts faster to price
- MA filters noise better
- Use moving averages with structure
- Do not trade crossovers alone
- Watch price reaction near averages
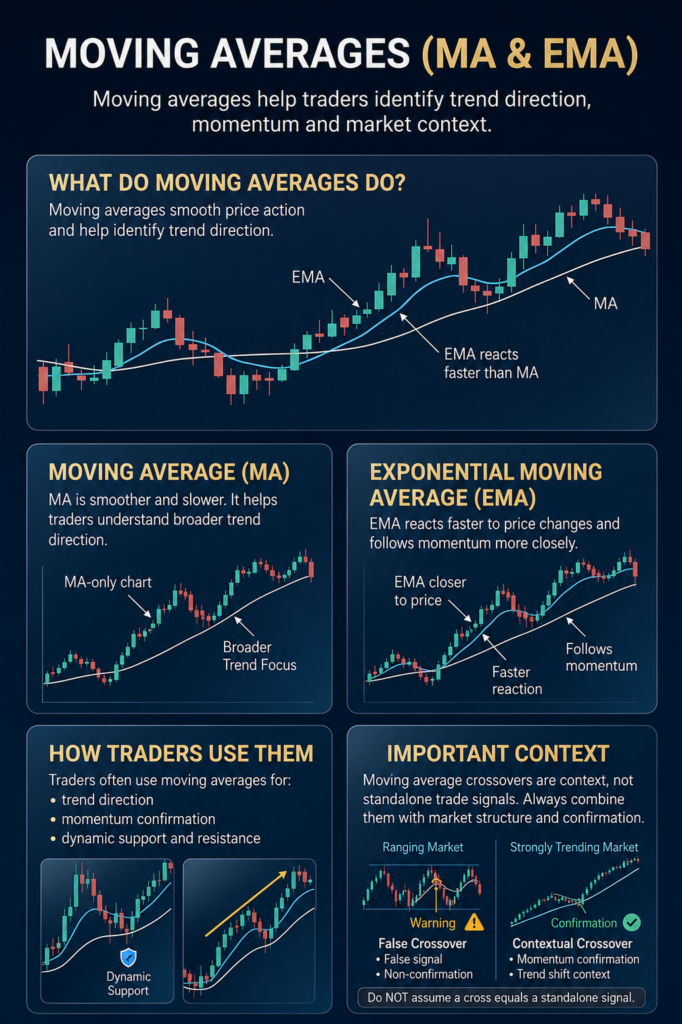
Moving averages smooth price action and help traders understand trend direction and momentum.
They also act as dynamic support and resistance during trending markets.
What Moving Averages Do
Moving averages help filter noise and reveal the bigger market direction.
- Show trend direction
- Measure momentum
- Help identify pullback zones
- Act as dynamic support or resistance
Price above moving averages often signals strength. Price below them often signals weakness.
EMA vs MA
EMA (Exponential Moving Average) reacts faster to price changes.
- Follows momentum closely
- Works well in fast markets
- Good for shorter-term reactions
MA (Moving Average) reacts slower and smooths volatility.
- Filters market noise
- Works well for trend direction
- Useful on higher timeframes
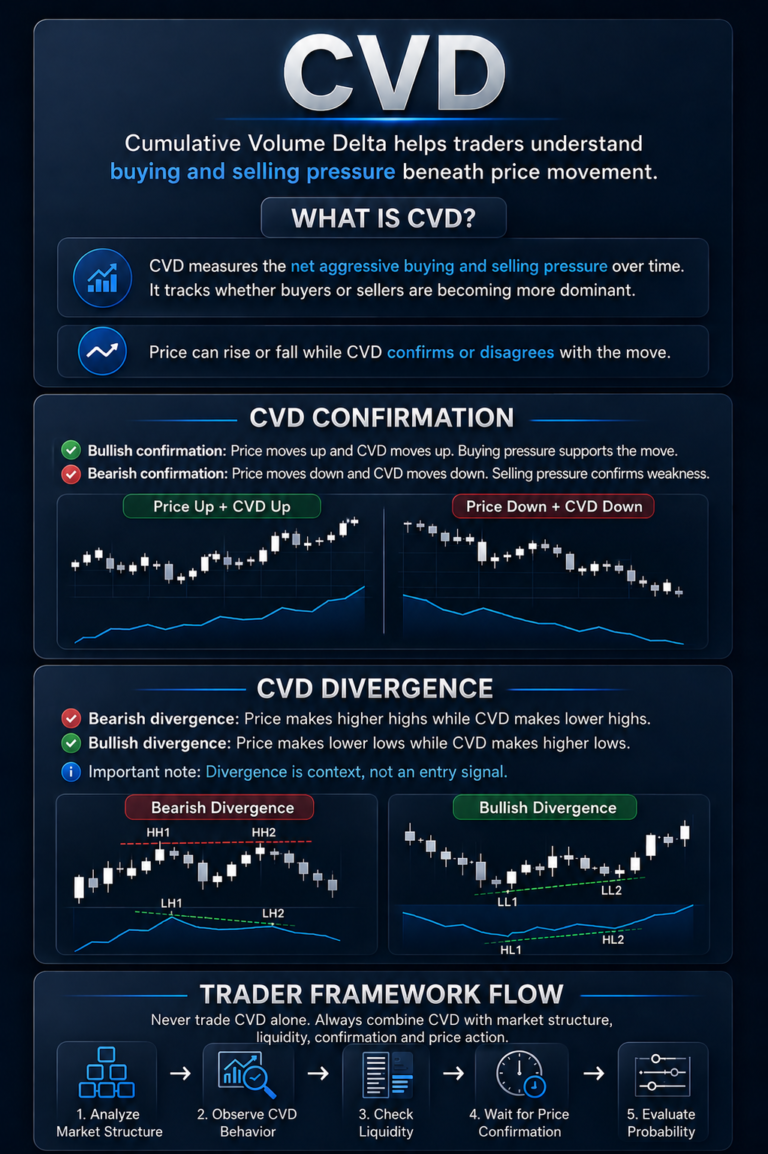
Crossovers
Crossovers happen when EMA and MA cross each other.
- EMA crossing above MA can suggest bullish momentum
- EMA crossing below MA can suggest bearish momentum
- Always confirm with market structure
Crossovers are context, not standalone signals.
Dynamic Support & Resistance
Price often reacts near moving averages during trends.
- Strong trends often bounce from EMA
- Deeper pullbacks may return to MA
- Uptrends often use averages as support
- Downtrends often use averages as resistance
Moving averages work best when combined with structure and liquidity.
Quick Recap
- EMA reacts faster than MA
- MA filters noise better
- Crossovers can show momentum shifts
- Moving averages help confirm trends
- Never use MA or EMA alone
- Moving averages are guides, not trade signals.
EMA Formula:
EMA = (Price × Multiplier) + Previous EMA × (1 − Multiplier)
Simple explanation:
Price
→ Current market price
Multiplier
→ Controls how much weight recent price receives
Previous EMA
→ The last EMA value
Multiplier Formula:
Multiplier = 2 ÷ (Period + 1)
Example:
For EMA 9:
2 ÷ (9 + 1) = 0.20
This means EMA 9 gives more weight to recent price movement.
Calculation Example:
BTC current price = $100,000
Previous EMA = $98,000
Multiplier = 0.20
EMA = (100,000 × 0.20) + (98,000 × 0.80)
EMA = 20,000 + 78,400
EMA = 98,400
Meaning:
The EMA moved higher, showing recent price movement gained more influence.
Reminder:
EMA reacts to price changes automatically. Traders often combine multiple EMAs to understand momentum and trend direction.