Liquidity & Volatility
Learn how liquidity and volatility influence execution, risk and market movement.

Liquidity & Volatility
- Follow liquidity, not emotion
- Expect volatility near key levels
- Avoid low liquidity fakeouts
- Adapt risk to market conditions
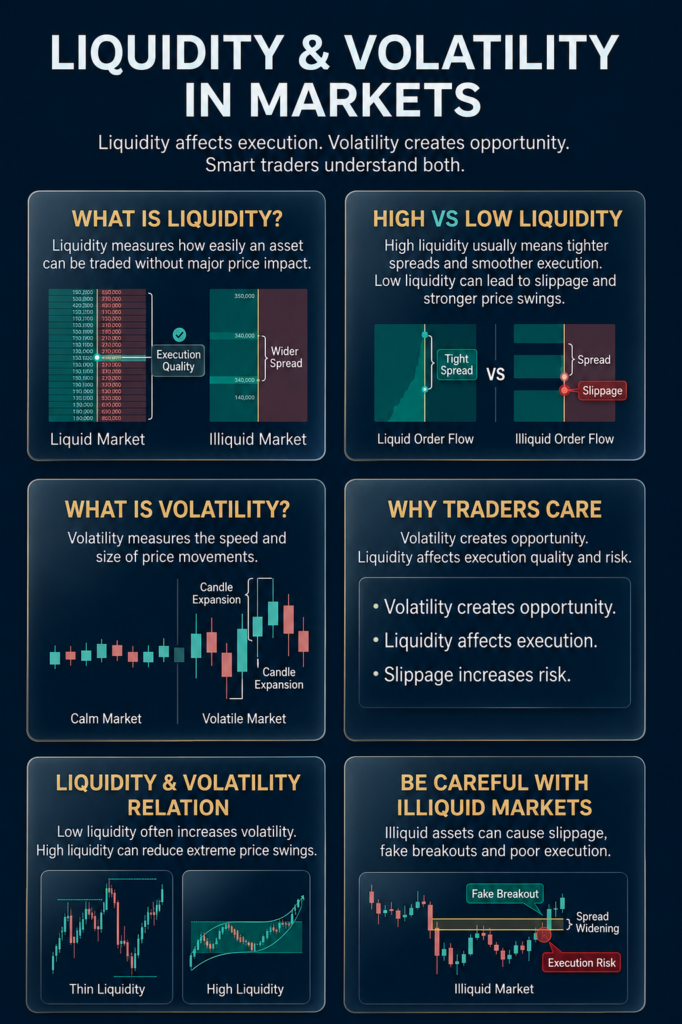
Liquidity controls how easily price moves. Volatility controls how far and how fast price moves. Together they shape execution, sweeps, breakouts and trends.
What Liquidity Means
Liquidity measures how easily orders can be filled without strong price disruption.
High liquidity often creates cleaner structure and smoother execution.
- Tighter spreads
- Cleaner movement
- Lower slippage
- More stable price action
Low liquidity often creates unstable movement and fakeouts.
- Large wicks
- Fast spikes
- Unexpected sweeps
- Higher slippage
Liquidity often builds above highs and below lows where many stop losses sit.
What Volatility Means
Volatility measures how aggressively price expands or contracts.
High volatility creates more opportunity but also more risk.
- Larger moves
- Faster execution
- Higher emotional pressure
- Wider stop losses
Low volatility often creates slow ranges and delayed movement.
- Smaller candles
- Less momentum
- Fewer setups
- Often followed by expansion
How To Use This
- Expect sweeps near liquidity pools
- Reduce size during unstable volatility
- Avoid forcing trades in low-volume ranges
- Trade with the environment, not against it
Strong traders follow liquidity and adapt to volatility.
Quick Recap
- Liquidity controls execution
- Volatility controls movement
- High volatility means higher opportunity and risk
- Low liquidity creates fakeouts and wicks
- Adapt risk to market conditions
- Liquidity drives movement. Volatility controls risk.
Volatility Formula:
((High − Low) ÷ Low) × 100
= Volatility Percentage
Example:
If BTC moves from $100,000 to $105,000:
((105000 − 100000) ÷ 100000) × 100
= 5% volatility
How to read it:
- Higher percentage = more volatility
- Lower percentage = calmer price action
- Higher volatility often needs more breathing room
- Lower volatility often creates tighter movement
Advanced context:
ATR (Average True Range) helps automate volatility measurement.
Many traders use ATR to estimate normal price movement and improve stop loss placement.
Beginner Pro-Tips:
- The Compression Alert: volatility often moves in cycles. Extremely low volatility or ATR readings can signal that expansion may be approaching
- The ATR Stop Loss Guide: if an asset normally moves 3% per candle, very tight stop losses may get hit by normal market noise
- The Counter-Balance Rule: higher volatility usually requires a wider stop loss and smaller position size to keep risk stable
- The News Warning: extreme events like CPI releases, exchange news or major token listings can create abnormal volatility spikes
Golden Rule:
Volatility changes risk, not direction. Measure volatility first, then adapt stop loss distance and position size to market conditions.