RSI
Learn how RSI helps identify momentum, market extremes and potential reversals.

RSI
- Never trade RSI alone
- Use RSI with structure and liquidity
- Look for divergence near key zones
- Confirm reversals before entering
RSI helps traders understand momentum and identify when price may be moving too aggressively in one direction.
RSI is not a signal generator. It works best as confirmation alongside structure, liquidity and context.
What RSI Measures
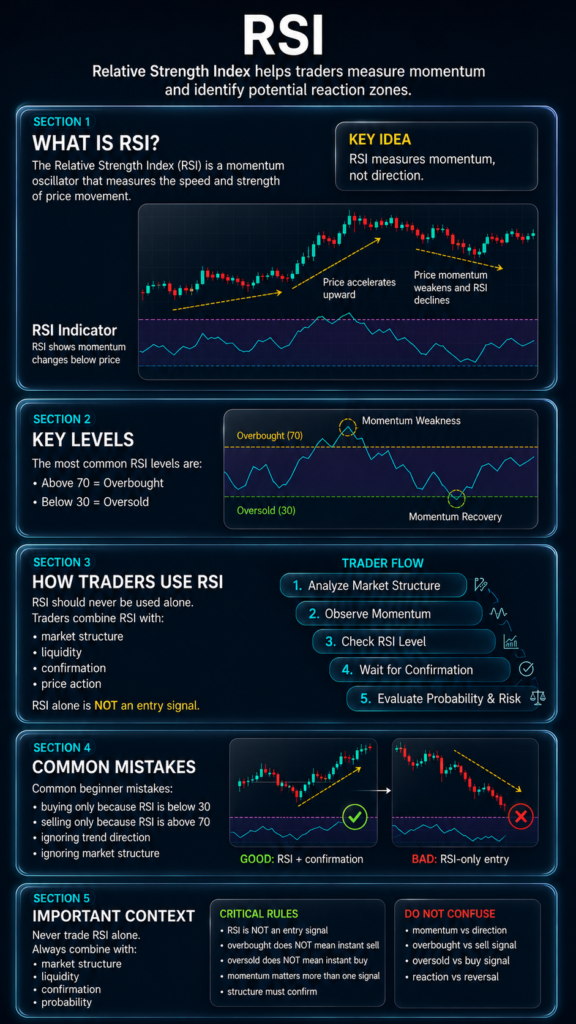
RSI measures momentum strength, not trend direction.
Strong momentum often supports continuation. Weak momentum may warn that price is losing strength.
Markets can stay aggressive longer than expected. Strong trends often remain extended before reacting.
Divergence: The Real Edge
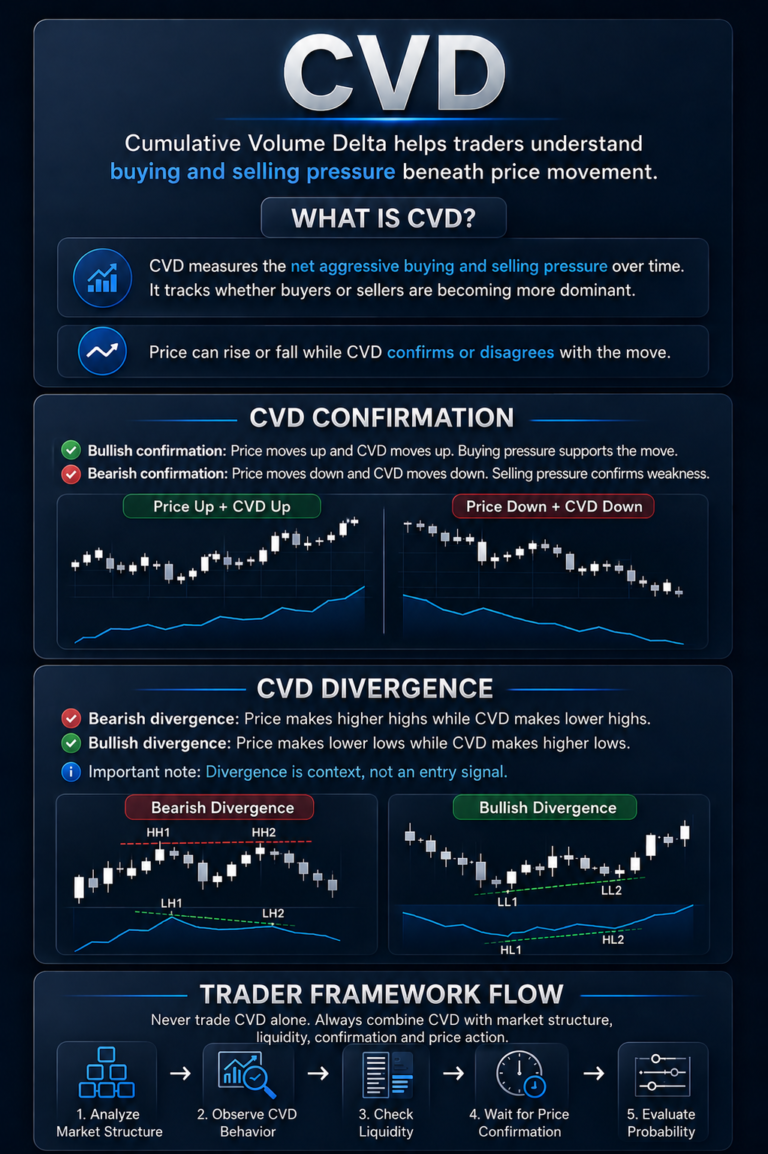
Divergence happens when price and momentum stop moving together.
- Price pushes higher but RSI weakens = momentum slowing
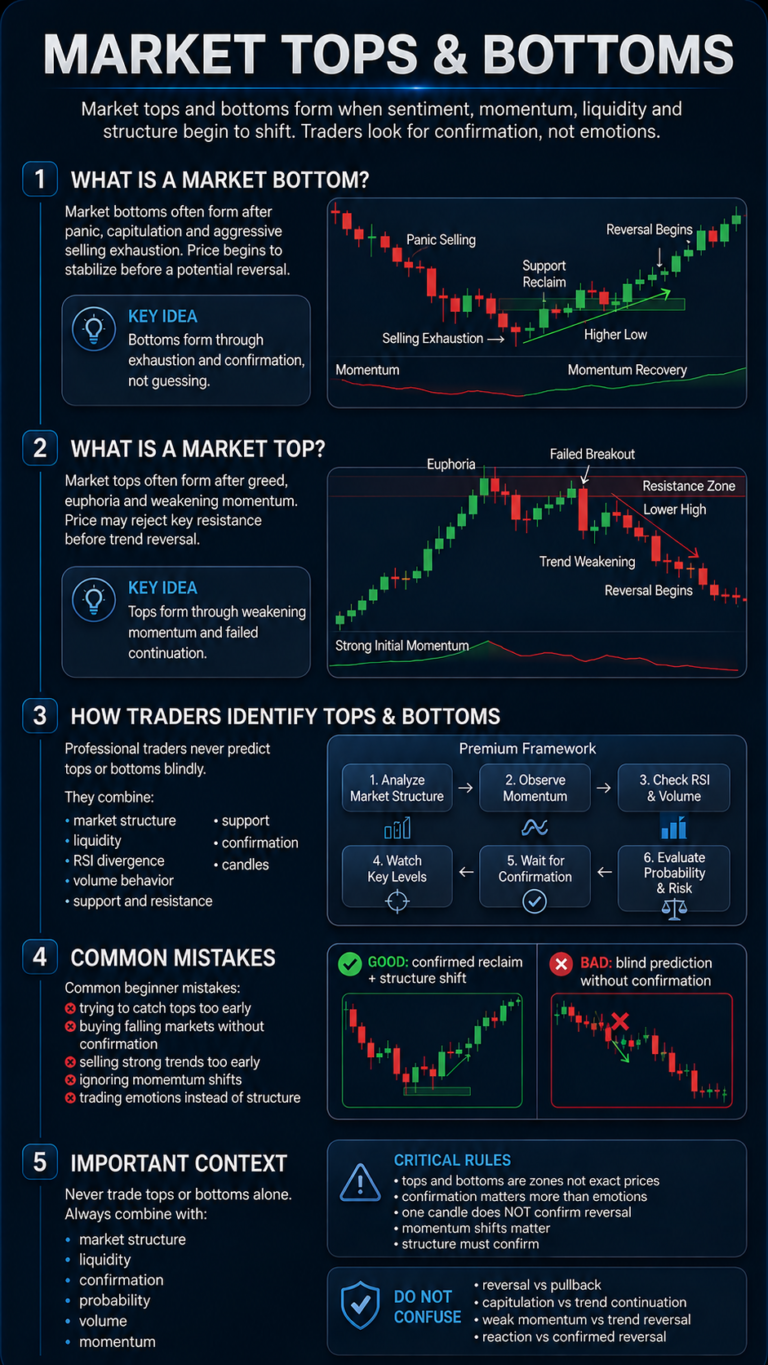
- Price pushes lower but RSI strengthens = selling pressure weakening
Divergence acts as an early warning signal, not instant confirmation.
Most useful when combined with:
- Liquidity sweeps
- Order Blocks or Supply & Demand zones
- CHoCH or BOS confirmation
- Major reaction areas
How To Use RSI In Trading
- Start with higher timeframe structure
- Wait for price to reach an important level
- Check if momentum supports or weakens the move
- Look for confirmation before entering
- Use lower timeframe for timing
RSI helps improve timing. Structure still decides the direction.
Common Mistakes
- Trading RSI without structure
- Buying or selling too early
- Ignoring market context
- Treating RSI as a standalone signal
Quick Recap
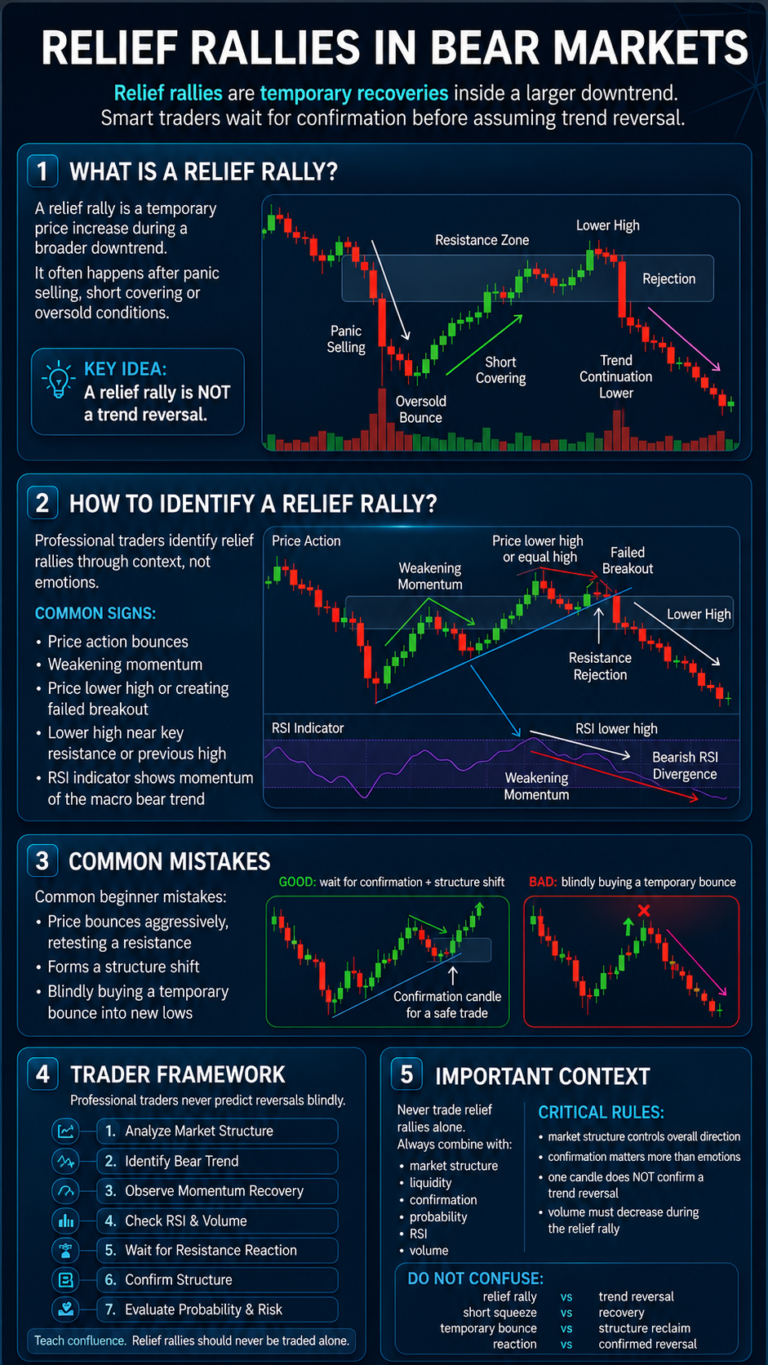
- RSI measures momentum
- Divergence can warn of weakness
- Momentum alone is not confirmation
- Always combine RSI with structure and liquidity
- RSI helps with timing. Structure confirms direction.
RSI Strength Formula:
RSI > 70 = Overbought
RSI < 30 = Oversold
RSI > 50 = Bullish momentum
RSI < 50 = Bearish momentum
How to read it:
- Above 70 = market may be overheated
- Below 30 = market may be oversold
- Above 50 = bullish momentum stronger
- Below 50 = bearish momentum stronger
- Extreme readings show momentum pressure, not guaranteed reversals
The Trend Filter:
The 50 level often acts as a momentum divider.
In strong bearish trends, RSI can stay below 50 for long periods.
Many traders wait for RSI to reclaim the 50 level before becoming more bullish.
The Overbought Trap:
RSI above 70 does not automatically mean sell.
Strong crypto trends can stay overbought for longer than expected.
High RSI often shows strength, not immediate reversal.
Advanced clue:
If price makes a higher high but RSI makes a lower high, momentum may be weakening.
This can warn that trend strength is fading.
Golden Rule:
RSI is a confirmation tool, not an entry trigger. Let structure lead and momentum confirm.